Showing posts with label Forex market news. Show all posts

Monday, January 4, 2021

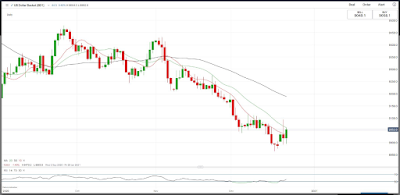
USD/JPY struggles near multi-week lows, just below 103.00 mark

USD/JPY struggles near multi-week lows, just below 103.00 mark


  • Sustained USD selling bias failed to assist USD/JPY to preserve its early modest gains.
  • The risk-on mood undermined the safe-haven JPY and helped limit losses for the pair.
  • The set-up favour of bearish traders and support prospects for further near-term losses.

The USD/JPY pair languished near the lower end of its daily trading range, with bears awaiting some follow-through selling below the 103.00 mark.

The pair failed to capitalize on its Asian session uptick, instead met with some fresh supply near the 103.30 region and dropped to near three-week lows on the first trading day of 2021. The intraday pullback of around 30-35 pips was exclusively sponsored by the prevalent bearish sentiment surrounding the US dollar.

The likelihood of additional US financial aid package and expectations that the Fed will keep interest rates lower for a longer period kept the USD depressed through the first half of the trading action on Monday. However, a combination of factors weighed on the Japanese yen and extended some support to the USD/JPY pair.

Monday, December 28, 2020

Gold Price Analysis: XAU/USD eyes monthly top near $1,907 as Trump signs covid aid package – Confluence Detector

Gold Price Analysis


Gold prices stay positive near a one-week high, currently up 0.80% while easing from the intraday high of $1,900.35 to $1,895, during early Monday. In doing so, the yellow metal extends the last Wednesday’s recovery moves from $1,859 toward the monthly top as the market’s sentiment improve on US President Donald Trump’s signing of the coronavirus (COVID-19) aid package.

Following his initial rejection, Trump surprised global markets during the early Asian trading while signing the US covid aid package for $600 paycheck and an additional $300 weekly unemployment supplement, per the New York Times.

Also supporting the market sentiment could be the extension of Brexit optimism and a lack of data/events amid the year-end holiday season.

Gold: Key levels to watch

Technically, the yellow metal’s ability to stay past 61.8% Fibonacci retracement on the monthly chart, around $1,889, propels the bulls to eye 100-SMA on one day (1D), near $1,898 offers as an immediate target ahead of the $1,900 round-figure.

However, Pivot Point one-month (M1) Resistance 1, coupled with the monthly peak surrounding $1,907 lures the gold buyers for now while November’s top near $1,965 can lure the bullion buyers afterward.

Meanwhile, a downside break of $1,889 level, resistance turned into support, can offer short-term support during the quote pullback moves.


During the commodity’s weakness past-$1,889, 5-SMA on four-hour (4H) near $1,884 and the previous week’s low near $1,855 could gain the market’s attention.

XAU  USD

About Confluence Detector

The TCI (Technical Confluences Indicator) is a tool to locate and point out those price levels where there is a congestion of indicators, moving averages, Fibonacci levels, Pivot Points, etc. Knowing where these congestion points are located is very useful for the trader, and can be used as a basis for different strategies.

Source: https://www.fxstreet.com/

Wednesday, December 23, 2020

ASX 200, Nikkei 225 Open Higher as Nasdaq 100 Leads a Defensive Play


NASDAQ 100, NIKKEI 225, ASX 200 INDEX OUTLOOK

NASDAQ 100, NIKKEI 225, ASX 200 INDEX OUTLOOK:

  • ASX 200, Nikkei 225 indexes opened mildly higher amid a relatively quiet pre-holiday trading
  • US House and Senate have passed a giant spending bill of US$ 2.3 trillion, in line with expectations
  • Falling industrial metal and crude oil prices flag the risk of softer demand as pandemic wave hits.

MIXED US SESSION, FALLING METAL PRICES, STRONGER USD, ASIA-PACIFIC AT OPEN:

A defensive session led by the tech sector may set a mixed tone for Asia-Pacific markets on Wednesday, with the ASX 200 and Nikkei 225 index opening mildly higher amid a relatively quiet holiday week. It is worth noting that the passing of a US stimulus package failed to inspire positive reactions among risk assets, as the expectations have largely been priced in over the past few weeks. Falling industrial metals and crude oil prices, alongside a rebound in the US Dollar, suggest that overall sentiment remains weak and there seems to be near-term demand for safety.

Concerns over a new type of coronavirus strain, which is reportedly 70% more transmissible than the original, has weighed on the prospects for global economic recovery. The potential for wider spread may threaten further lockdown measures and travel bans between the UK and Europe in a time when both sides are trying to finalize a post-Brexit trade agreement. More than 40 countries have banned UK arrivals because of the new virus strain and further restrictions are likely if the situation worsens.

Tech outperformed cyclical sectors on Wall Street and this theme is likely to play out across Asia-Pacific markets as well. Investors weighed stricter lockdown measures before the gradual rollout of vaccines helps to bring down the number of infections. The Dow Jones and S&P 500 fell 0.67% and 0.21% respectively whereas the tech-led Nasdaq 100 gained 0.51%.

The rising US Dollar threatens stock markets’ astonishing rally, as the DXY US Dollar index has exhibited a strong negative correlation with the S&P 500 index over the past 12 months. More than 40% of the S&P 500 companies’ revenue comes from overseas markets, which infers that a stronger USD will translate into lower overseas income due to forex changes. Same for the emerging markets, which are sensitive to the strength of the US Dollar as it tends to influence capital flows.

For now, however, recent strengthening in the US Dollar appears more like a technical rebound driven by demand for safety. Profit-taking activity following the passing of the US stimulus package has probably played a part too.

DXY US Dollar Index

DXY US Dollar Index


On the macro front, US existing home sales figures came in at 6.69 million, or -2.5% MoM. This marks the first MoM decline observed since May 2020 as a result of soaring house prices and constrains in supply. The US economy expanded at annualized rate of 33.4% QoQ in the third quarter, slightly higher than baseline forecast of 33.1%. Today, the US Core PCE price index, durable goods orders and Michigan consumer sentiment index are among the top events to watch for. Read more on DailyFX calendar.


US Existing Home Sales MoM (November)

US Existing Home Sales MoM (November)

Source: Bloomberg, DailyFX

Sector-wise, 9 out of 11 S&P 500 sectors ended lower, with 65.5% of the index’s constituents closing in the red on Tuesday. Energy (-1.74%), communication services (-0.99%) and financials (-0.96%) were among the laggards, while information technology (+0.86%) and real estate (+0.61%) outperformed.

S&P 500 Sector Performance 22-12-2020


S&P 500 Sector Performance 22-12-2020

Source: Bloomberg, DailyFX

Nasdaq 100 Index Technical Analysis

The Nasdaq 100 index is trending up within the “Ascending Channel” formed since early November, forming higher highs. The overall trend remains bullish-biased, as suggested by upward-sloped 20-, 50- and 100-Day Simple Moving Average (SMA) lines. Its upward momentum, however, appears to be faltering as the MACD indicator trends lower after the formation of a “Death Cross” in early December. Immediate support and resistance levels can be found at 12,530 and 12,790 respectively.

Nasdaq 100 Index  Daily Chart

Nasdaq 100 Index – Daily Chart


Nikkei 225 Index Technical Analysis:

The Nikkei 225 index has been trading in a “range-bound” condition since early December as highlighted in red color below. Immediate support and resistance levels can be found at 26,350 and 27,000 respectively. Breaking this support may open the door for further losses with an eye on 26,000 for support.

Nikkei 225 Index  Daily Chart

Nikkei 225 Index – Daily Chart

ASX 200 Index Technical Analysis:

The ASX 200 index has likely broken the “Ascending Channel” this week (chart below) and the overall momentum has turned bearish as suggested by the MACD indicator. An immediate support level can be found at 6,570 – the lower Bollinger Band. Price has pierced below the middle Bollinger Band (also the 20-Day SMA), suggesting that near-term trend has likely turned bearish.

ASX 200 Index – Daily Chart

ASX 200 Index – Daily Chart

--- Written by Margaret Yang, Strategist for DailyFX.com