
NASDAQ 100, NIKKEI 225, ASX 200 INDEX OUTLOOK:
- ASX 200, Nikkei 225 indexes opened mildly higher amid a relatively quiet pre-holiday trading
- US House and Senate have passed a giant spending bill of US$ 2.3 trillion, in line with expectations
- Falling industrial metal and crude oil prices flag the risk of softer demand as pandemic wave hits.
MIXED US SESSION, FALLING METAL PRICES, STRONGER USD, ASIA-PACIFIC AT OPEN:
A defensive session led by the tech sector may set a mixed tone for Asia-Pacific markets on Wednesday, with the ASX 200 and Nikkei 225 index opening mildly higher amid a relatively quiet holiday week. It is worth noting that the passing of a US stimulus package failed to inspire positive reactions among risk assets, as the expectations have largely been priced in over the past few weeks. Falling industrial metals and crude oil prices, alongside a rebound in the US Dollar, suggest that overall sentiment remains weak and there seems to be near-term demand for safety.
Concerns over a new type of coronavirus strain, which is reportedly 70% more transmissible than the original, has weighed on the prospects for global economic recovery. The potential for wider spread may threaten further lockdown measures and travel bans between the UK and Europe in a time when both sides are trying to finalize a post-Brexit trade agreement. More than 40 countries have banned UK arrivals because of the new virus strain and further restrictions are likely if the situation worsens.
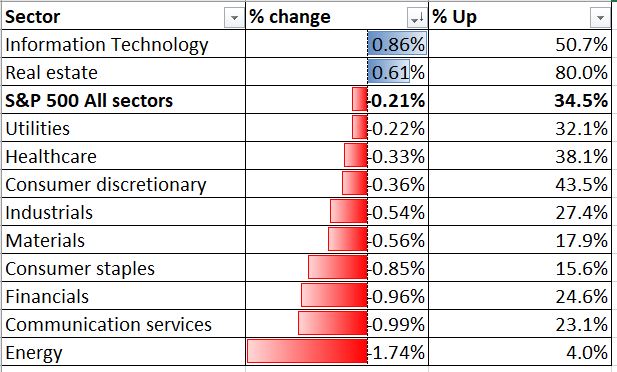
Tech outperformed cyclical sectors on Wall Street and this theme is likely to play out across Asia-Pacific markets as well. Investors weighed stricter lockdown measures before the gradual rollout of vaccines helps to bring down the number of infections. The Dow Jones and S&P 500 fell 0.67% and 0.21% respectively whereas the tech-led Nasdaq 100 gained 0.51%.
The rising US Dollar threatens stock markets’ astonishing rally, as the DXY US Dollar index has exhibited a strong negative correlation with the S&P 500 index over the past 12 months. More than 40% of the S&P 500 companies’ revenue comes from overseas markets, which infers that a stronger USD will translate into lower overseas income due to forex changes. Same for the emerging markets, which are sensitive to the strength of the US Dollar as it tends to influence capital flows.
For now, however, recent strengthening in the US Dollar appears more like a technical rebound driven by demand for safety. Profit-taking activity following the passing of the US stimulus package has probably played a part too.
DXY US Dollar Index

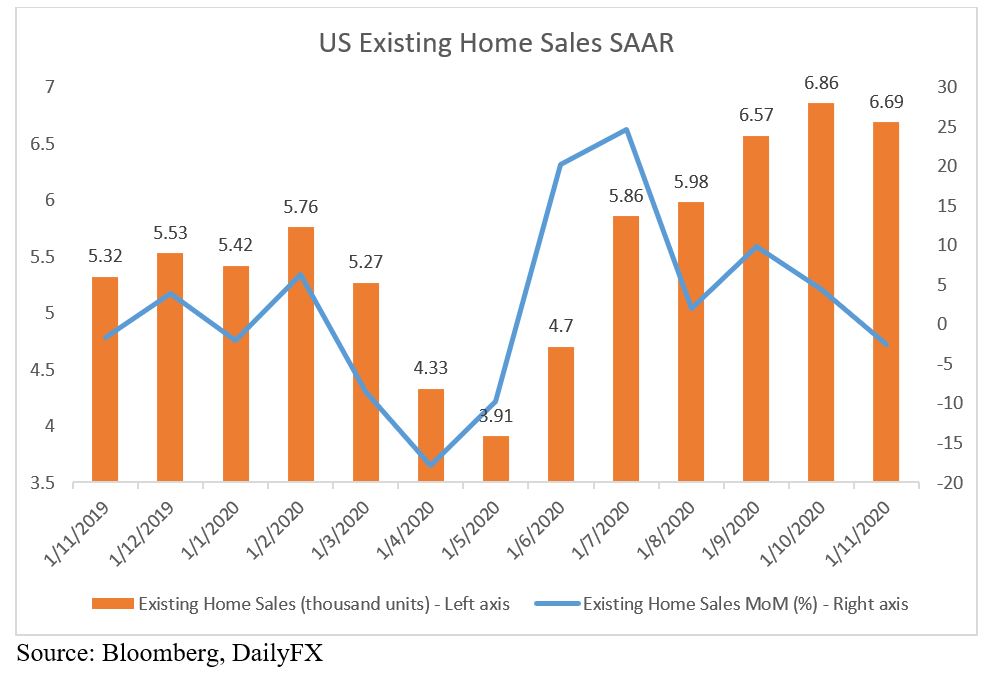
US Existing Home Sales MoM (November)
")
Source: Bloomberg, DailyFX
S&P 500 Sector Performance 22-12-2020

Source: Bloomberg, DailyFX
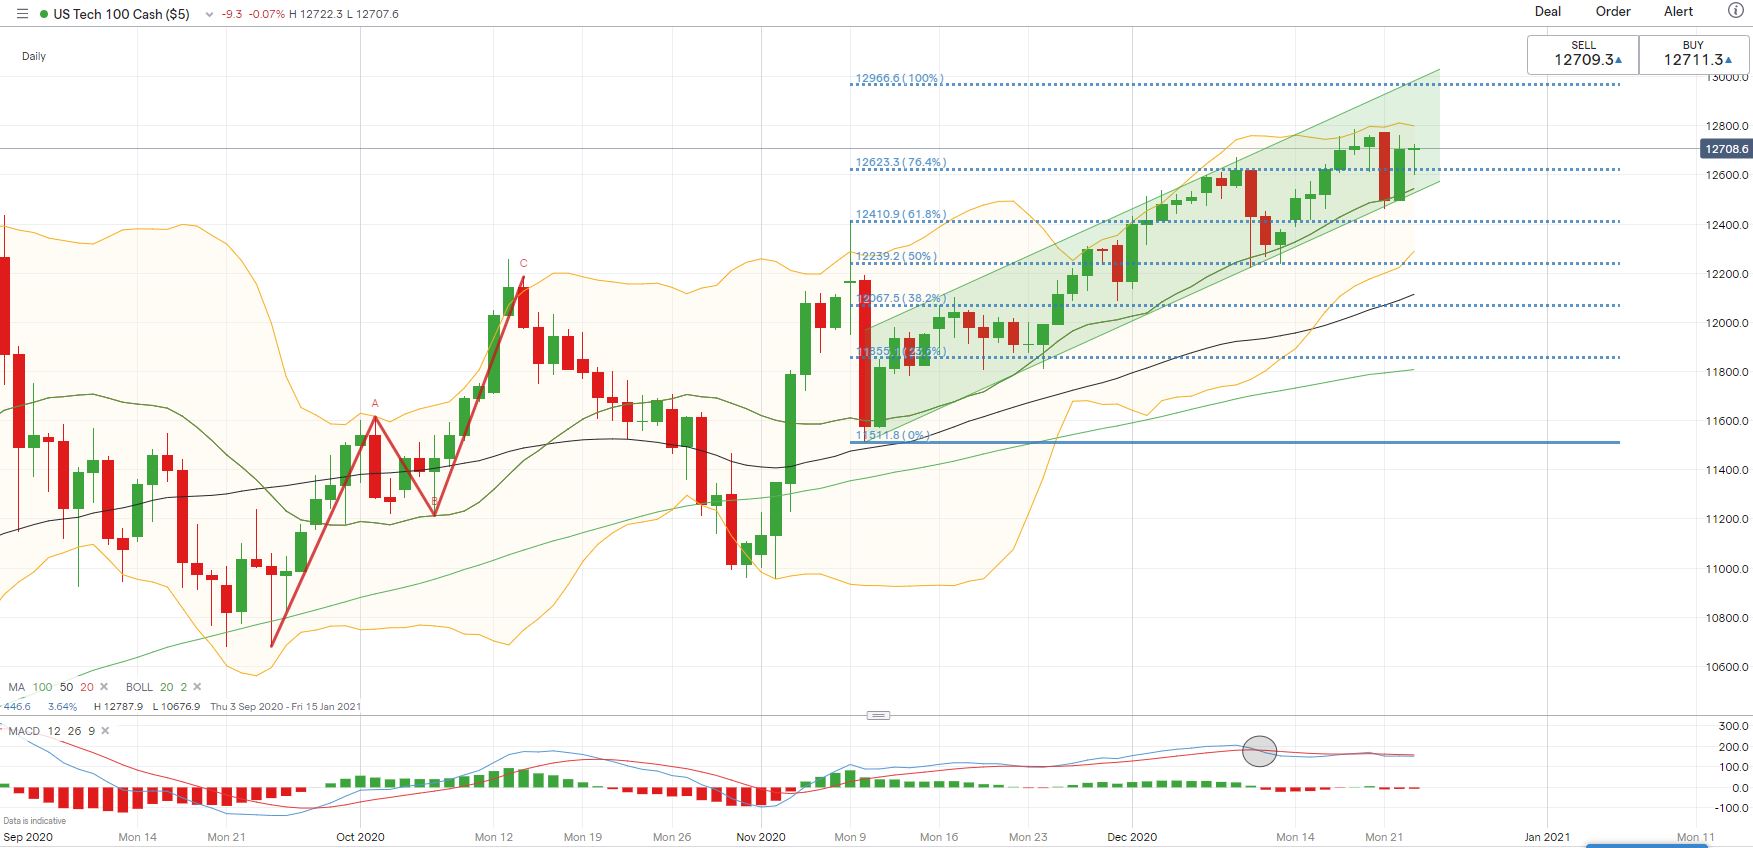
Nasdaq 100 Index Technical Analysis
The Nasdaq 100 index is trending up within the “Ascending Channel” formed since early November, forming higher highs. The overall trend remains bullish-biased, as suggested by upward-sloped 20-, 50- and 100-Day Simple Moving Average (SMA) lines. Its upward momentum, however, appears to be faltering as the MACD indicator trends lower after the formation of a “Death Cross” in early December. Immediate support and resistance levels can be found at 12,530 and 12,790 respectively.
Nasdaq 100 Index – Daily Chart

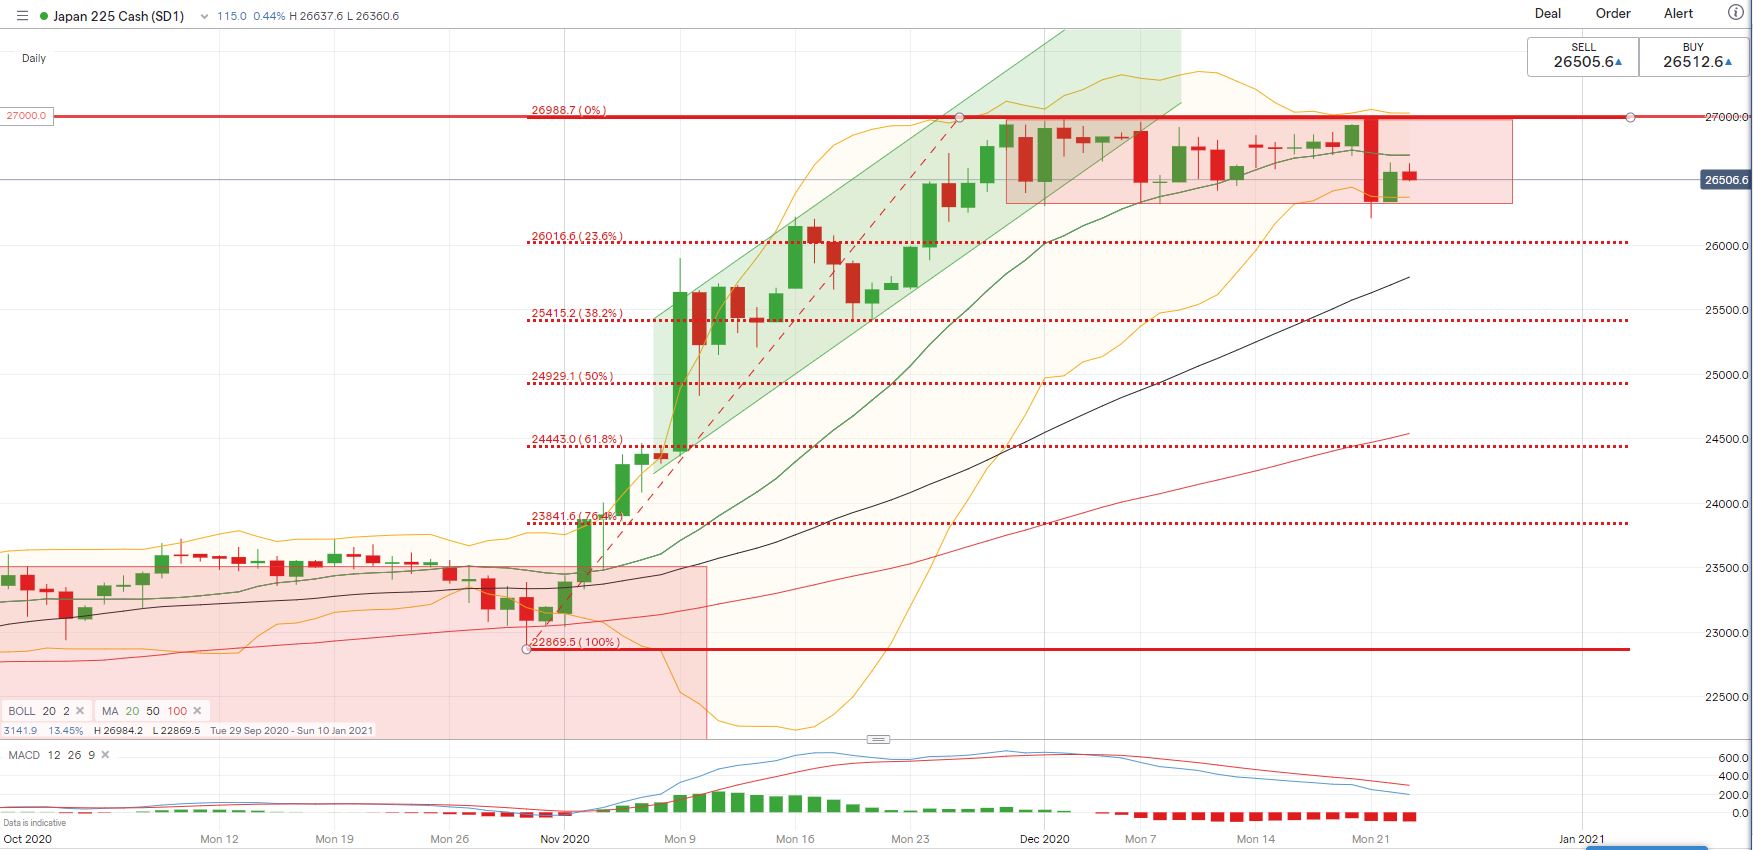
Nikkei 225 Index Technical Analysis:
The Nikkei 225 index has been trading in a “range-bound” condition since early December as highlighted in red color below. Immediate support and resistance levels can be found at 26,350 and 27,000 respectively. Breaking this support may open the door for further losses with an eye on 26,000 for support.
Nikkei 225 Index – Daily Chart

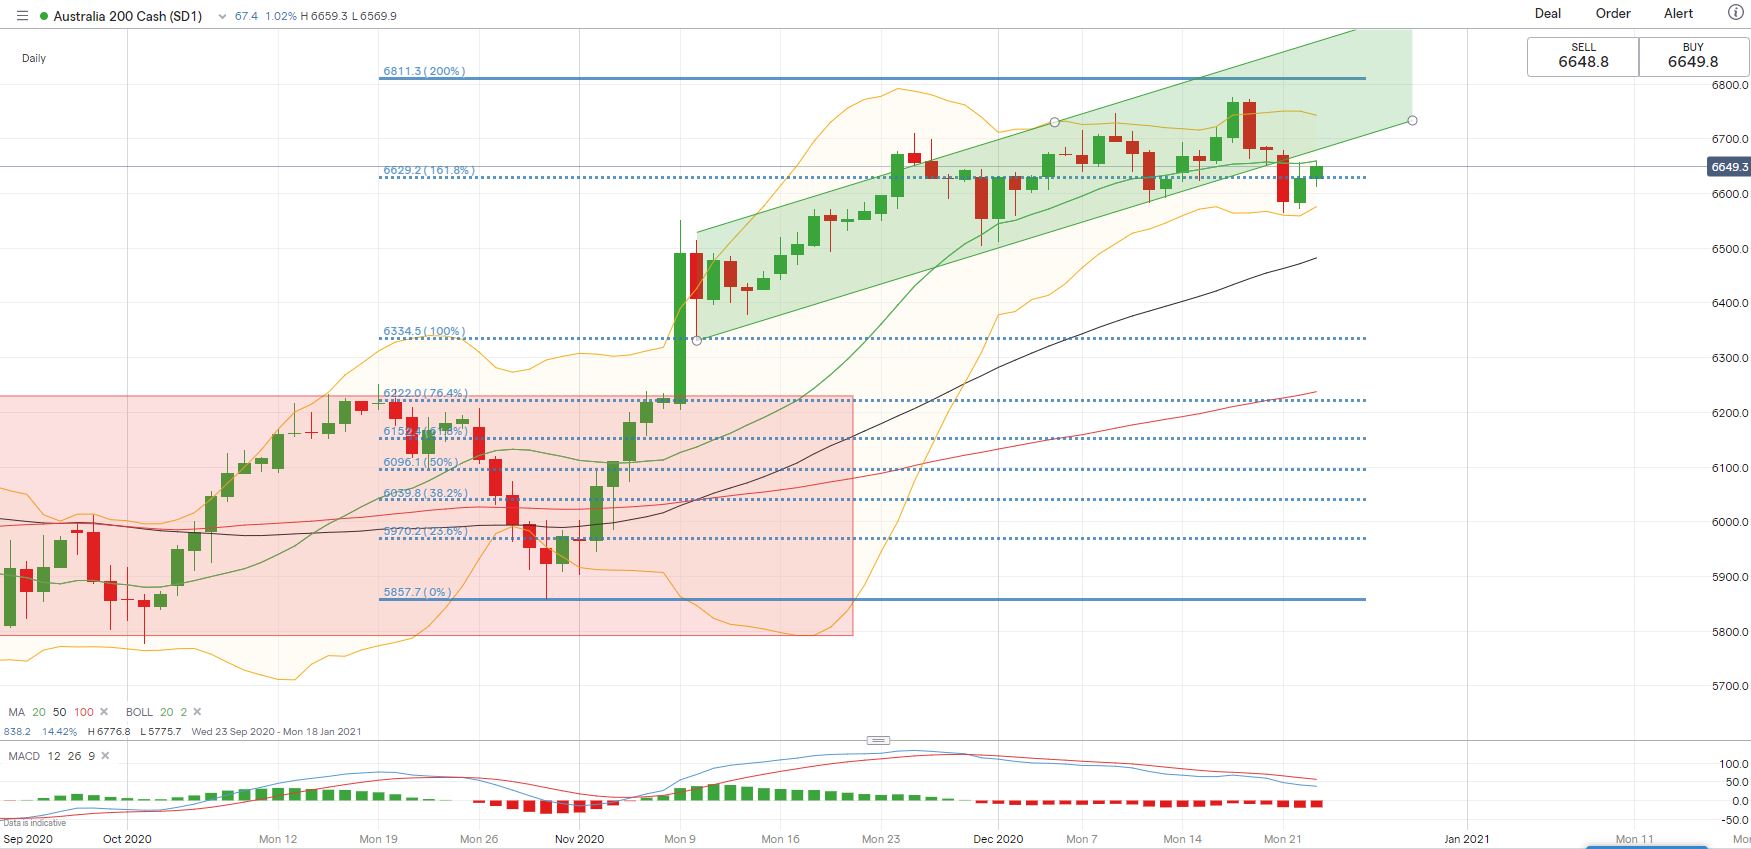
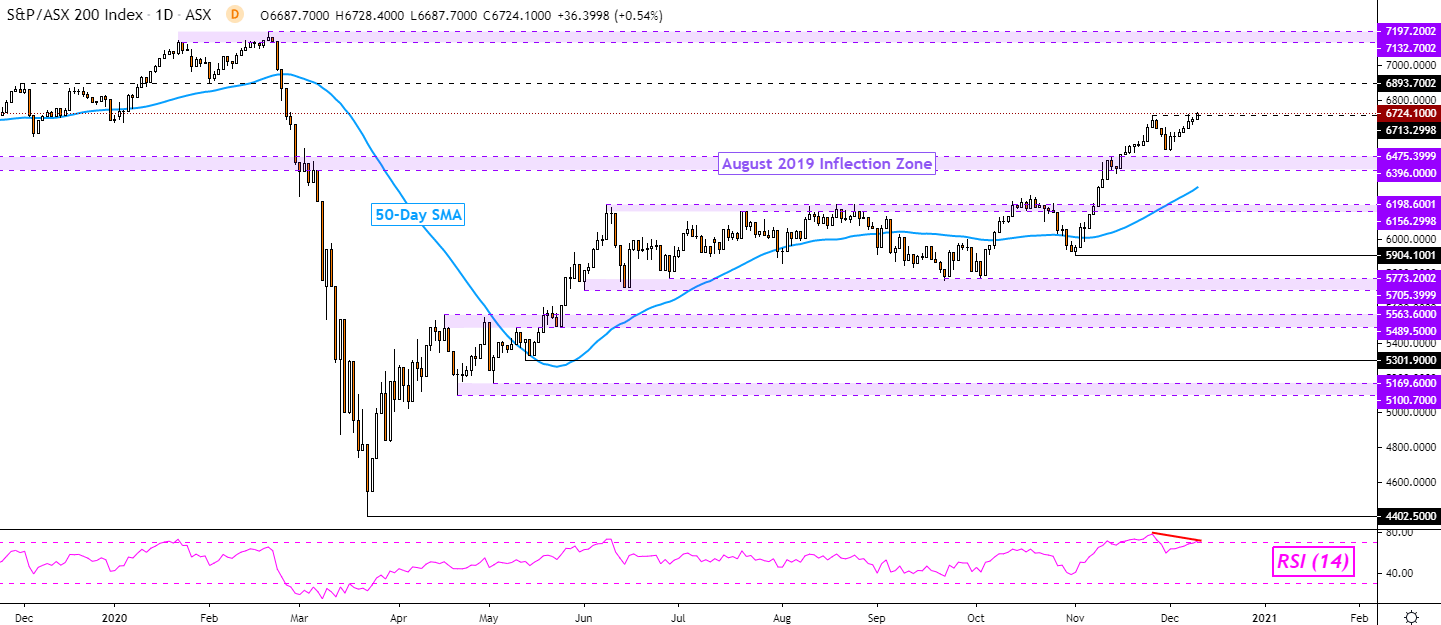
ASX 200 Index Technical Analysis:
The ASX 200 index has likely broken the “Ascending Channel” this week (chart below) and the overall momentum has turned bearish as suggested by the MACD indicator. An immediate support level can be found at 6,570 – the lower Bollinger Band. Price has pierced below the middle Bollinger Band (also the 20-Day SMA), suggesting that near-term trend has likely turned bearish.
ASX 200 Index – Daily Chart

--- Written by Margaret Yang, Strategist for DailyFX.com


